
Show Me the Data: Clinical Report Design Techniques · Part 5 of 5
Clinical Report Design: When AI Joins The Team
AI gives us a new way to turn clinical data into something people can use, but it also changes who is making some of the design decisions. Part 5 looks at two approaches: giving AI detailed instructions for structured clinical notes and reports, or giving it more freedom to decide how information should be organized and visualized, while keeping verification, reproducibility, and human review in view.
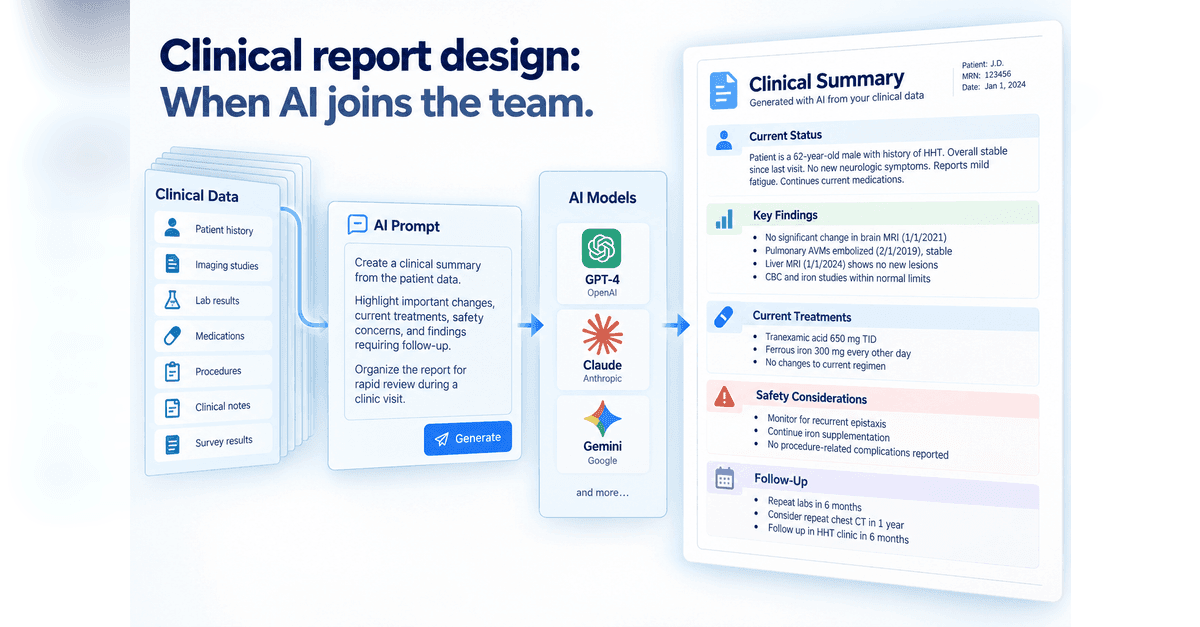
For most of this series, we've assumed that someone is designing the report.
We decide what belongs on stage. We decide how information should be represented. We decide what belongs together and how the report should support the person using it.
Traditionally, many of those decisions are then translated into programming. The same data run through the same rules and produce a predictable report.
AI gives us another option.
We can provide the clinical data, describe what we're trying to accomplish, and ask a model to help create the report.
How much we tell it is an interesting design decision in itself.
Tell It Exactly What You Want
For text-based reports, one approach is to be fairly prescriptive.
Suppose we want to generate a clinic note from data collected during a visit. We might tell the model exactly how the note should be organized, what information belongs in each section, what should be emphasized, and what should be left out.
A prompt might include instructions such as:
Create a clinical note using the patient data provided. Organize the note into Current Status, Interval History, Current Treatments, Key Findings, Safety Concerns, and Follow-Up. Prioritize information that has changed since the previous visit. Include relevant dates and values when available. Do not infer information that is not present in the data.
The prompt could become considerably more detailed than that.
We might define how medications should be presented, which laboratory findings deserve mention, how missing information should be handled, what terminology should be used, or how particular combinations of findings should be summarized.
In that sense, the prompt begins to function almost like a report specification.
The difference is that we don't necessarily have to specify every sentence. We can describe the structure, priorities, and rules we care about and let the model handle much of the writing.
That can work particularly well for clinical notes because the desired output is primarily text.
Or Give AI More Room
A visual clinical report presents a somewhat different opportunity.
We could still provide detailed instructions:
Put current medications in the upper right. Use red for safety concerns. Show patient-reported outcomes as gauges. Display treatments and imaging on a common timeline.
That gives us considerable control over the result.
But we can also give the model the data, audience, and purpose and ask a broader question:
Here are the available data for this patient. Design a clinical report that would help a physician quickly understand the patient's current status, important changes, treatments, safety concerns, and information requiring follow-up.
Now we're allowing the model to make more of the design decisions.
It might decide that a timeline would make the treatment history easier to understand. It might bring an abnormal laboratory result forward. It might summarize several years of imaging rather than displaying every study equally. It might determine that a particular patient-reported outcome deserves more visual prominence than another.
This brings us back to the same question we've used throughout the series:
What are we trying to help someone understand or do?
Rather than answering every subsequent design question ourselves, we can give AI the purpose, data, audience, and constraints and allow it to propose some of the answers.
Give It Feedback
The first report doesn't have to be the final report.
Maybe the result is too dense.
Make the report easier to scan during a clinic visit.
Maybe an important piece of information is getting buried.
Make recent safety events more prominent.
Maybe historical information is overwhelming the patient's current state.
Emphasize current status. Keep the older history available but visually subordinate it.
Or perhaps a visualization simply isn't working.
The medication history is difficult to understand. Try showing medication changes over time rather than as a conventional table.
That feedback becomes part of the design process.
Instead of anticipating every design decision before anything is built, we can react to something we can actually see. This may be particularly useful for visual reports, where it can be much easier to recognize that a visualization isn't working than to perfectly describe the right visualization beforehand.
Over time, those corrections can also improve the instructions we provide on the next attempt.
Selection and Summarization Aren't Quite the Same
There is an important distinction in how much we ask AI to do.
Suppose a report contains forty laboratory results and AI identifies five that deserve attention. A reviewer can see what the model selected and compare those five with the underlying forty.
Now suppose the model instead writes:
Renal function remains stable.
That's a different kind of output.
The model has not simply selected information. It has interpreted multiple observations and expressed a conclusion about them. Verifying that statement requires checking the conclusion against the underlying data.
Both can be useful. But they aren't necessarily equally easy to verify.
That distinction becomes increasingly important as AI moves from finding and organizing information toward interpreting and summarizing it.
Predictability Still Matters
A traditional programmatic report has an important advantage: predictability.
Give the program the same data and the same rules, and we expect the same output in the same place.
An AI-generated report may be more flexible, but flexibility comes with different considerations. The output needs to be checked. The way clinical data are provided to a model needs to comply with the privacy, security, organizational, and regulatory requirements that apply to those data. And when generated content becomes part of clinical work, there needs to be clarity about who reviews and takes responsibility for it.
That doesn't mean everything has to be either programmatic or AI-generated.
A report might retain predetermined calculations, tables, safety rules, or other components where consistency is particularly important while using AI to select information, draft narrative sections, or propose ways to organize more complicated information.
Where that balance belongs will depend on the report and its purpose.
The Old Rules Haven't Disappeared
AI changes how a report can be created. It doesn't eliminate the questions we've been asking throughout this series.
What deserves attention?
How should it be represented?
What information needs to be understood together?
How should the report be organized around the patient, question, or task?
Those questions can become instructions we give the model. They can also become criteria we use to evaluate what the model creates.
Over time, we may need to provide fewer of the answers ourselves. As models become better at working with clinical data and generating useful visual representations, we may increasingly be able to describe what someone needs to understand or accomplish and let AI propose the report.
For now, there's a useful new question to add to clinical report design:
How much should we design ourselves, and how much should we ask AI to design for us?
All parts in this series
Show Me the Data: Clinical Report Design Techniques
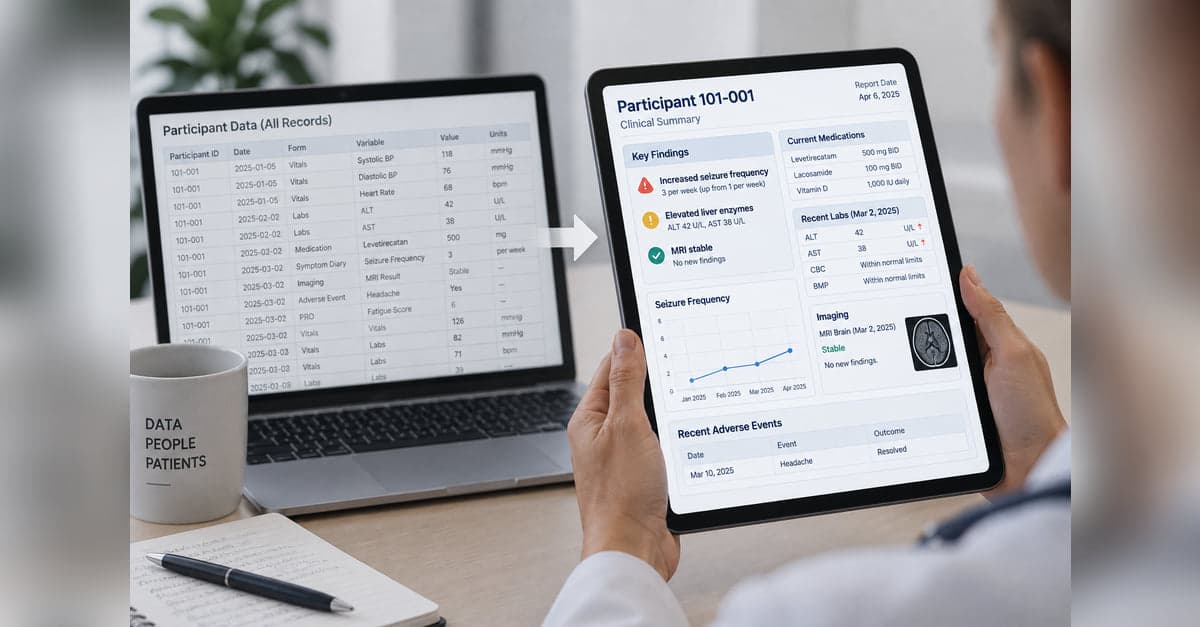
Collecting clinical data is one thing. Turning it into something people can quickly understand and use is another. This series explores practical approaches to clinical report design, from predictable, programmatic reports to AI-generated reports that adapt to the data and what matters for each patient.
Clinical Report Design: What Belongs on Stage?
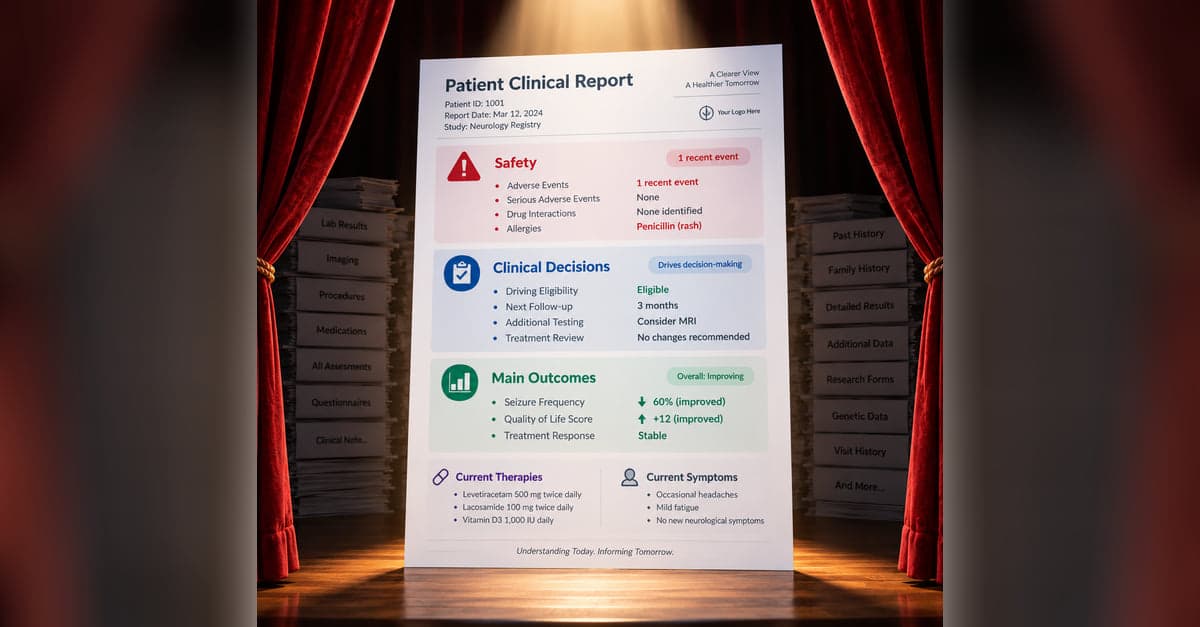
A clinical report can contain everything and still make the important information hard to find. Part 1 looks at how to decide what belongs in the foreground, what can recede into the background, and how to keep the details available when someone needs them.

Clinical Report Design: Ingredients of a Good Recipe
Once you've decided what belongs on a clinical report, the next challenge is deciding how that information should be represented. Part 2 looks at how color, spatial relationships, graphs, tables, timelines, and other visual cues can make meaning in the data easier to see.
Clinical Report Design: Connecting Big and Small Pieces
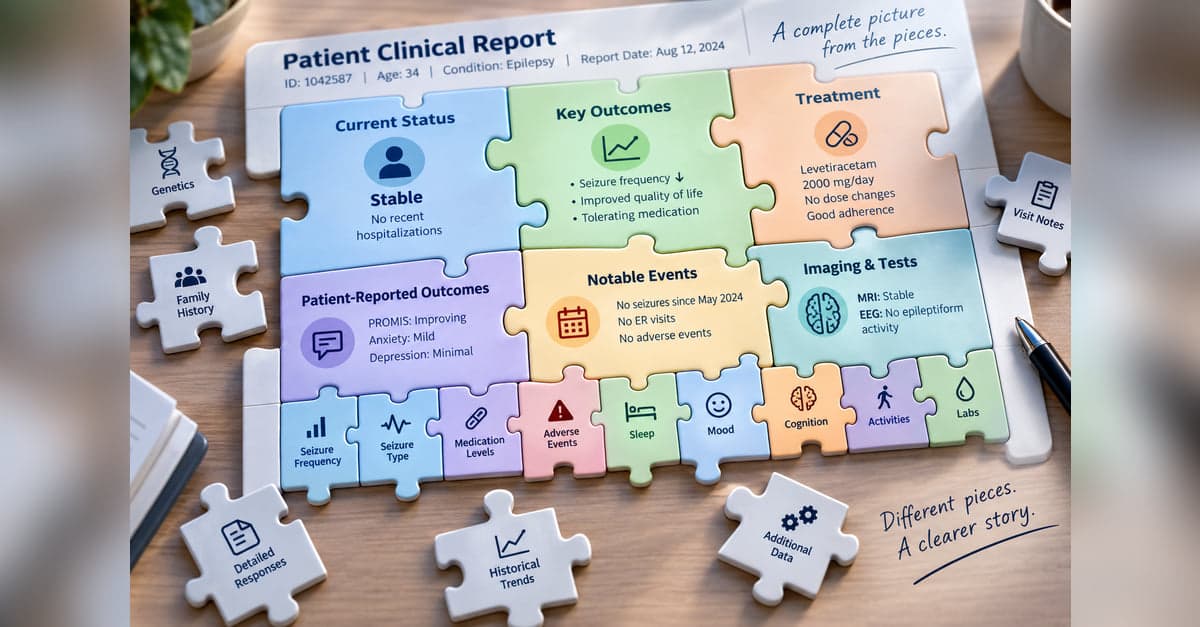
Years of clinical data can be difficult to understand one value at a time. Part 3 looks at how a report can summarize accumulated information and selectively bring forward current values, meaningful changes, and individual findings without losing access to the underlying details.
Clinical Report Design: A Picture Is Worth a Thousand Data Points
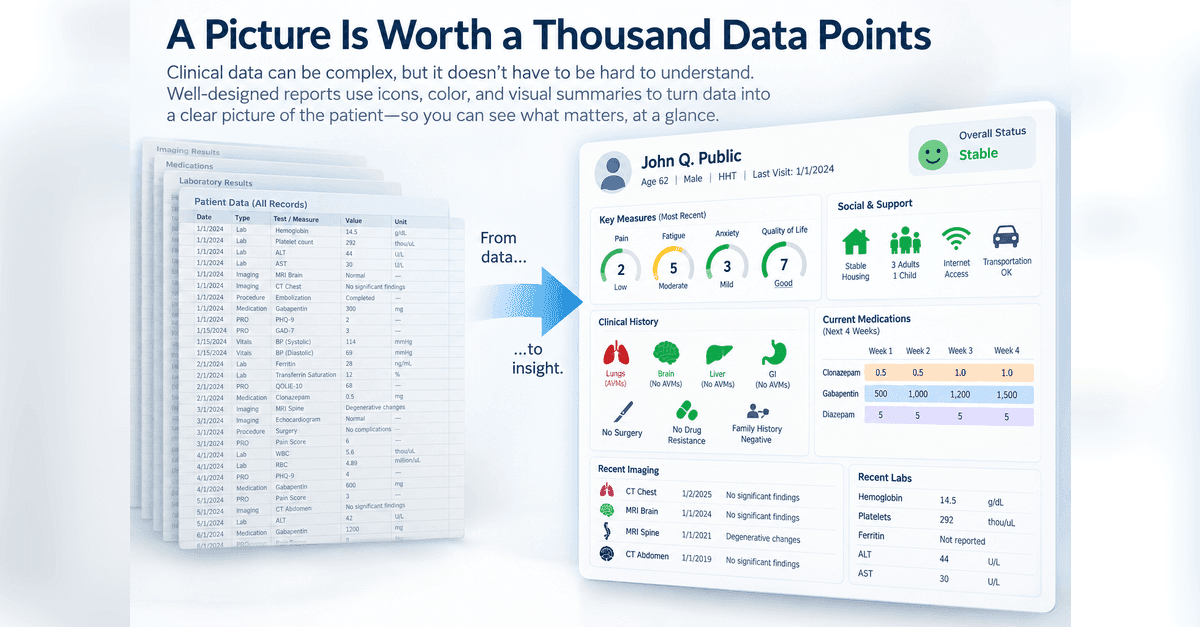
Clinical reports don't always need to make someone read numbers, scores, and text to understand what's happening. Part 4 looks at how visual representations can be combined into a larger picture organized around how someone understands the patient or what they need to do.
Clinical Report Design: When AI Joins The Team
AI gives us a new way to turn clinical data into something people can use, but it also changes who is making some of the design decisions. Part 5 looks at two approaches: giving AI detailed instructions for structured clinical notes and reports, or giving it more freedom to decide how information should be organized and visualized, while keeping verification, reproducibility, and human review in view.
Designing something like this yourself?
Tell us what you are building and we will show you how it maps onto Studytrax.
Get started